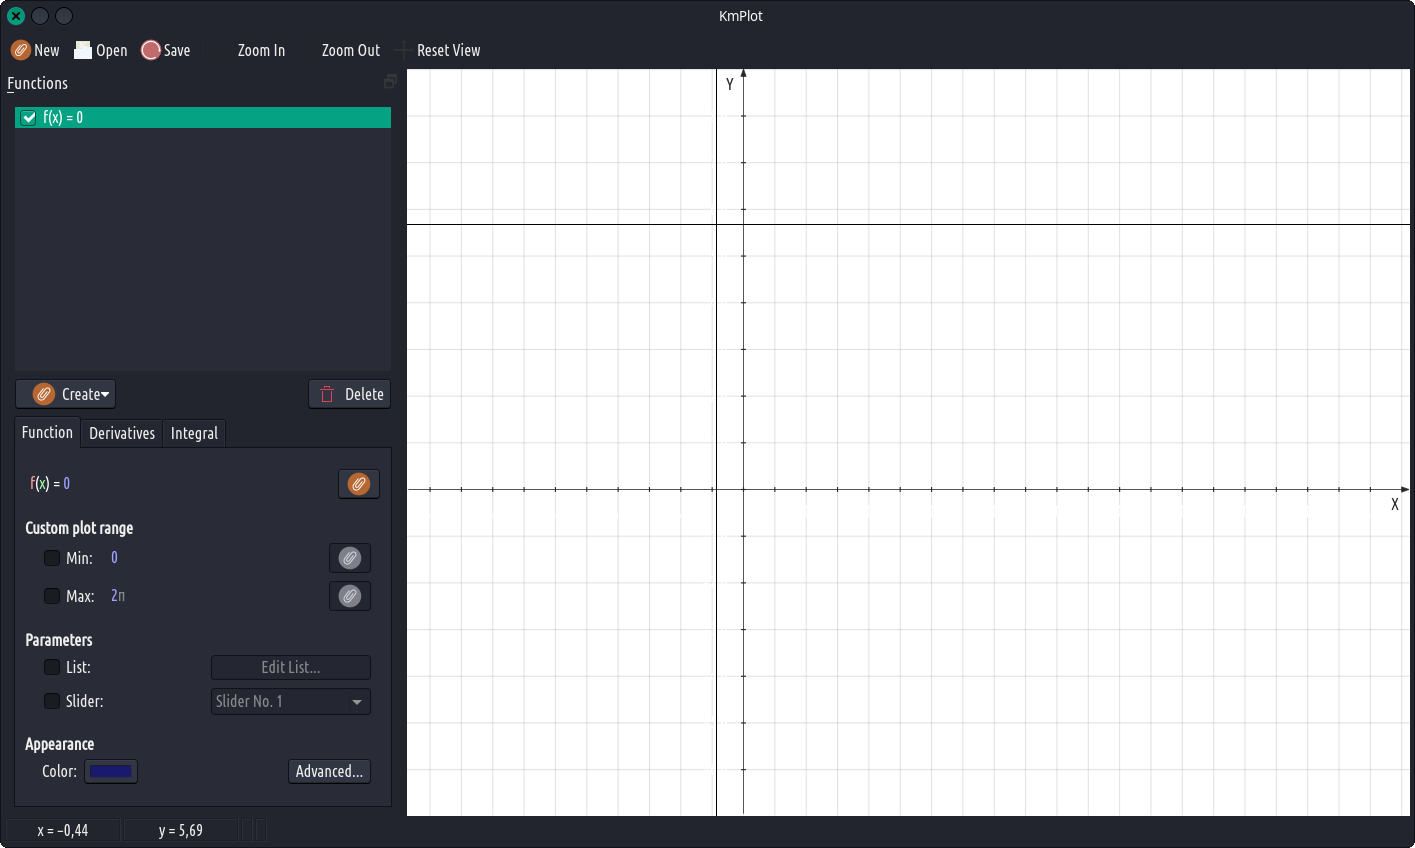
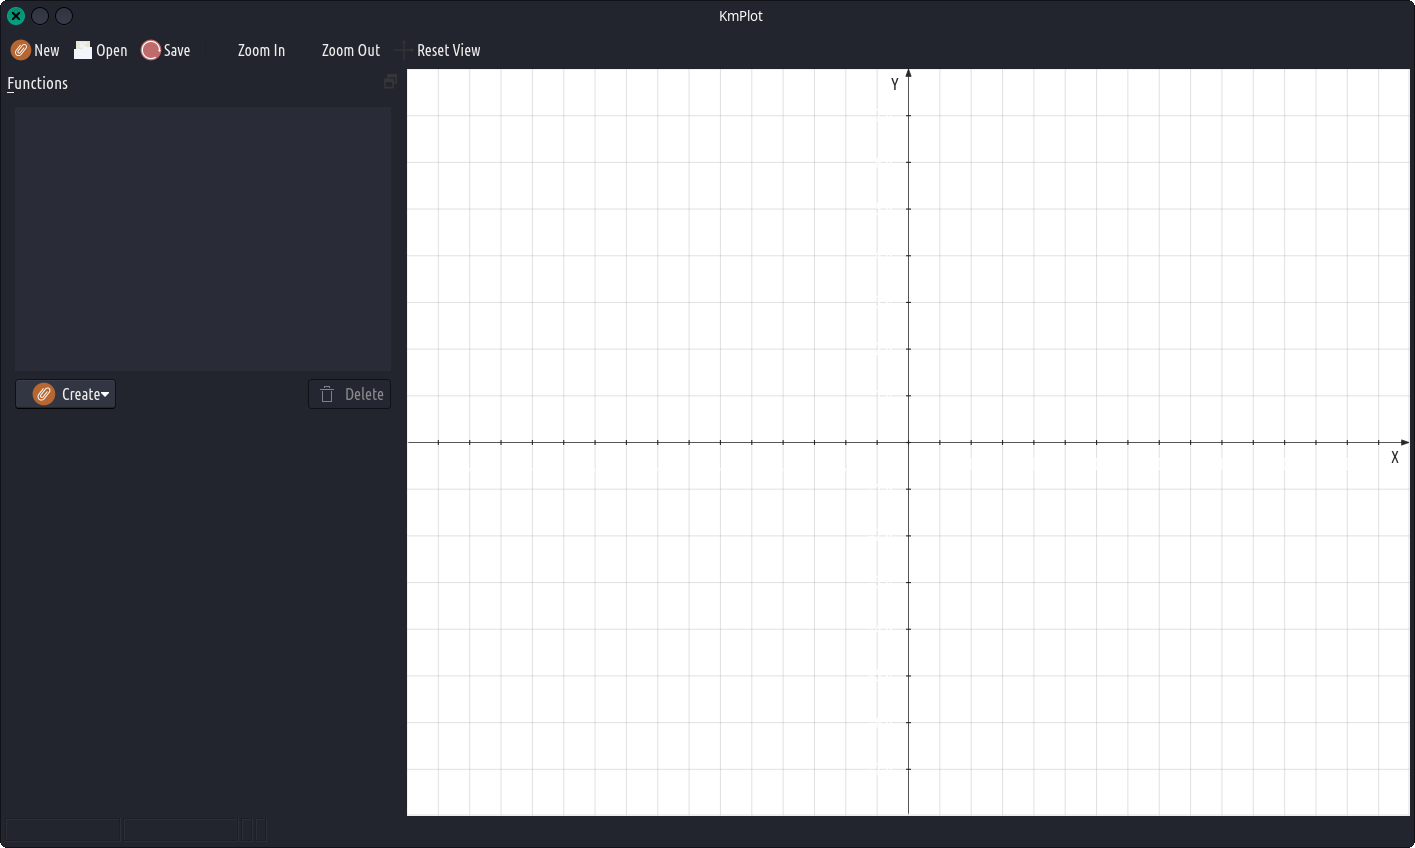
KmPlot is a program to plot graphs of functions, their integrals or derivatives. The graphs can be colorized and the view is highly configurable, is scalable, and can be zoomed. The program features a powerful mathematical parser, different plot types (cartesian, parametric, polar, implicit, differential), and provides simple mathematical tools like for finding maximum/minimum of a function. Parametrized functions can be visualized by adjusting the variable parameter via a slider. Plots can be exported as bitmap format pictures (BMP, PNG) and can be printed.
O le emoji picker o loʻo faʻaogaina e Ideogram e saunia e GTK. Soo se mea lava e uiga i le emoji picker lava ia e i fafo atu o le lautele o lenei app, ma fafo atu o laʻu pule. Mo se faʻataʻitaʻiga, o le emojis o loʻo tuʻuina atu, o le taʻavale gaioiga, le sailiga, upu autu, ma isi. Afai ei ai ni au faʻafitauli i le emoji picker, faʻamolemole faila i latou i le GTK ina ia mafai ona faʻaleleia e le gata mo Ideogram, ae mo polokalama uma ma faʻavae e fa'aaoga le GTK.